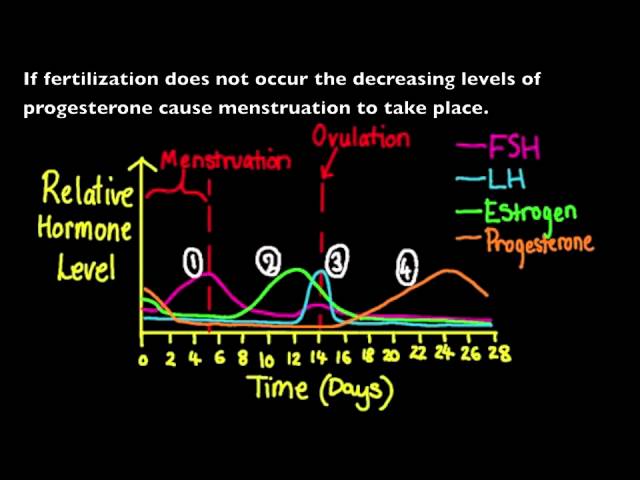
6.6.3 Annotate a graph showing hormone levels in the menstrual cycle, illustrating the relationship between changes in hormone levels and ovulation, menstruation and thickening of the endometrium We begin with the hormone FSH (Follicle Stimulating hormone). 1) FSH increasing causing the ripening of the Graafian follicles and stimulating estrogen production (an example of positive feedback). 2) Increases in estrogen levels cause the repair of the endometrium and stimulate LH (Luteinizing hormone) production — this is another example of positive feedback. 3) A peak in LH levels cause ovulation (the release of the ovum from the ovary to the oviduct) and the subsequent development of the corpus luteum. The corpus luteum is a temporary endocrine structure formed after the release of the ovum from the graafian follicles. Its role is to secrete progesterone and therefore levels of progesterone increase. 4) Increasing levels of progesterone maintain the endometrium in preparation for fertilization. a. If fertilization does occur the corpus luteum continues to secrete progesterone and the endometrium lining is maintained. b. If fertilization does not occur, the corpus luteum disintegrates, therefore decreasing progesterone levels. This means the endometrium is no longer maintained and so menstruation (the loss of the endometrium) takes place. c. Since there is a negative feedback relationship between progesterone and FSH, decreasing levels of progesterone result in increasing levels of FSH and this brings us back to the beginning of the cycle where we started from.

6.6.3 Annotate a graph showing hormone levels in the menstrual cycle
- Post author:
- Post published:May 5, 2021
- Post category:Uncategorized
- Post comments:0 Comments
You Might Also Like

How to stretch before running

Zumba – All of Me (Cool-down)

The Only Ab Exercise you really need!

Why You Should Take Folic Acid BEFORE Pregnancy

Lifestage Nutrition Video – 2

hormone replacement therapy – How to Increase Estrogen Healthy Life Styles

How to Do a Barbell Curl | Arm Workout

What should I eat after a workout – POST EXERCISE NUTRITION – BeerBiceps Diet

Get Pregnant Fast with Unexplained Infertility

Explosive Push Up – Killer home workouts for pecs & chest

Shrugs-5

Triceps Pulley Extension-1

Chifferi Pasta made interesting in 4 delicious ways – Del Monte Pasta

Pre Surgery Video – 6

The Scariest Side Effect of Pregnancy!

If You Eat 2 Eggs at Breakfast For a Month, This is What Happens to Your Body

Lateral Raises-10

BCAA on Anabolism / Catabolism

Why Can the Same Drug Treat Heart Attacks and Anxiety?

Accutane Isotretinoin Common Side Effects and Doubts Dr Lucas Brazil

Close grip tricep extensions supersetted w/ earthquake curls

Fat Loss, Weight Loss Video – 15

Alternate Knee Touch-3

6 Muscle Gaining Mistakes (SLOW OR NO GROWTH!!)

Top 3 Triceps Exercises with 1 Dumbbell! (Subscribers Request)

Bodybuilding Video – 4

Volleyball Video – 1

Pharmacokinetic of aspirin

what is the definition of Aerobic exercise (Medical Dictionary Online)

16 FOODS TO EAT ON A KETOGENIC DIET — Ketogenic Diet Foods.

Light Weights vs Heavy Weights for Muscle Growth

Best Antioxidant Drinks Even Better Than Green Tea ? | Dr.Michael Greger

Abscess – Causes, Treatments & More…

Endocrine System Activity: Adrenal Cortex

The Muscular System Explained In 6 Minutes

Skeletal System And Asanas Video – 1

What To Eat Before & After A Gym Workout

See What Happens To Your Body When You Start Taking Fish Oil Everyday

CREATINE ON CUTTING (क्रेटीने और कटिंग)- Does water retention |Causes bloating|

Bodybuilding Nutrition, Diet Recipes & Workout – 21

Best Foods for Liver Repair & Foods to Avoid For Healthy Liver

